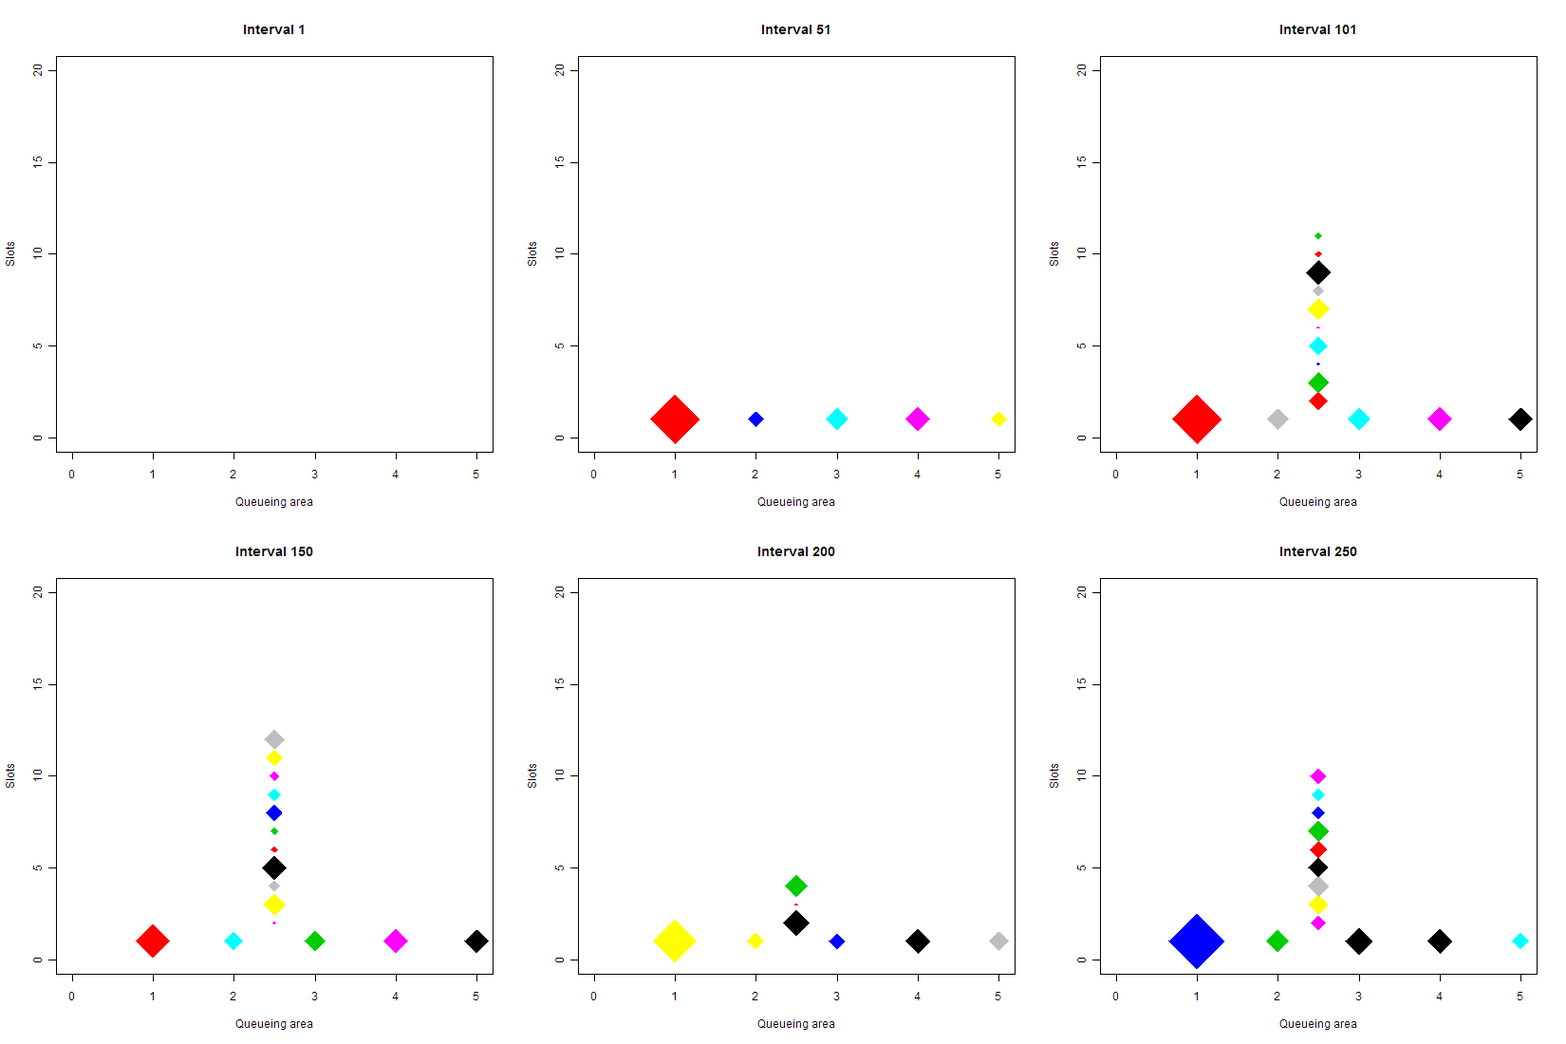
Shown above is a queueing simulation. Each diamond represents a person. The vertical line up is the queue; at the bottom are 5 slots where the people are attended to. The size of each diamond is proportional to the log of the time it will take them to be attended. Color is used to tell one person from another and doesn’t have any other meaning. Code for this simulation, written in R, is here. This is my second post about queueing simulation, you can find the first one, including an earlier version of the code, here. Thanks as always to commenters for their suggestions.
A few notes about the simulation:
- Creating an animation to go along with your simulation can take a while to program (unless, perhaps, you are coding in Flash), and it may seem like an extra, unnecessary step. But you can often learn a lot just by “watching”, and animations can help you spot bugs in the code. I noticed that sometimes smaller diamonds hung around for much longer then I expected, which led me to track down a tricky little error in the code.
- As usual, I’ve put all of the configuration options at the beginning of the code. Try experimenting with different numbers of intervals and tellers/slots, or change the mean service time.
- If you want to run the code, you’ll need to have ImageMagick installed. If you are on a PC, make sure to include the full path to “convert”, since Windows has a built-in convert tool might take precedence. Also, note how the files that represent the individual animation cells are named. That’s so that they are added in the animation in the right order, naming them sequentially without zeros at the beginning failed.
- I used Photoshop to interlace the animated GIF and resave. This reduced the file size by over 90%
- The code is still a work in progress, it needs cleanup and I still have some questions I want to “ask” of the simulation.
Tags: animation, queueing theory, r, simulations, stats


I think it is much better now to see the process. Can you tell me how you pick colours for the people?
Hi Lui, each new “person” that gets created is assigned a new sequential number. Then I use the mod function “%%” to get the remainder when divided by 153. These colors in R (see http://research.stowers-institute.org/efg/R/Color/Chart/) provide a nice range of hues and shades. Another good way to generate colors in R is to pick a random RGB hexadecimal. Check out how the colors were generated here: http://www.statisticsblog.com/2010/09/weekend-art-in-r-part-4/